Japan is known to be the origin of candlestick patterns, and as a result, candlestick patterns are also called Japanese candlestick patterns. They have been implemented in Japan since the 18th century, and now it has become a popular practice in the investment and trending space to predict the trend of the market, stocks, or other financial assets.
There are thousands of candlestick patterns available, and it can be hard to identify them. A bullish engulfing pattern is one of those candlestick patterns used in technical analysis. This article is your guide to know everything you need to know about this candlestick pattern. We will cover what a bullish engulfing pattern is, what it indicates with an example, its limitations, and how it is different from a bearish engulfing pattern in this article.
A bullish engulfing pattern is a part of the candlestick-based technical analysis performed to know the trend reversal possibility and the best time to invest in equity stock. It helps technical analysts know that a trend reversal is in store, and it’s time to take advantage of that.
As its name suggests, a bullish engulfing pattern shows a positive change in the trend, and it completely covers (engulfs) the red/bearish candle. It typically appears when the market or a stock is in a red and downward trend. The appearance of a bullish engulfing candle means that the trend will reverse, and the market or the stock will go upwards.
These are the main traits of a bullish engulfing pattern that helps you identify it.
The bullish engulfing pattern shows a reversal and indicates that the selling pressure is reducing with investors and traders focusing on buying momentum.
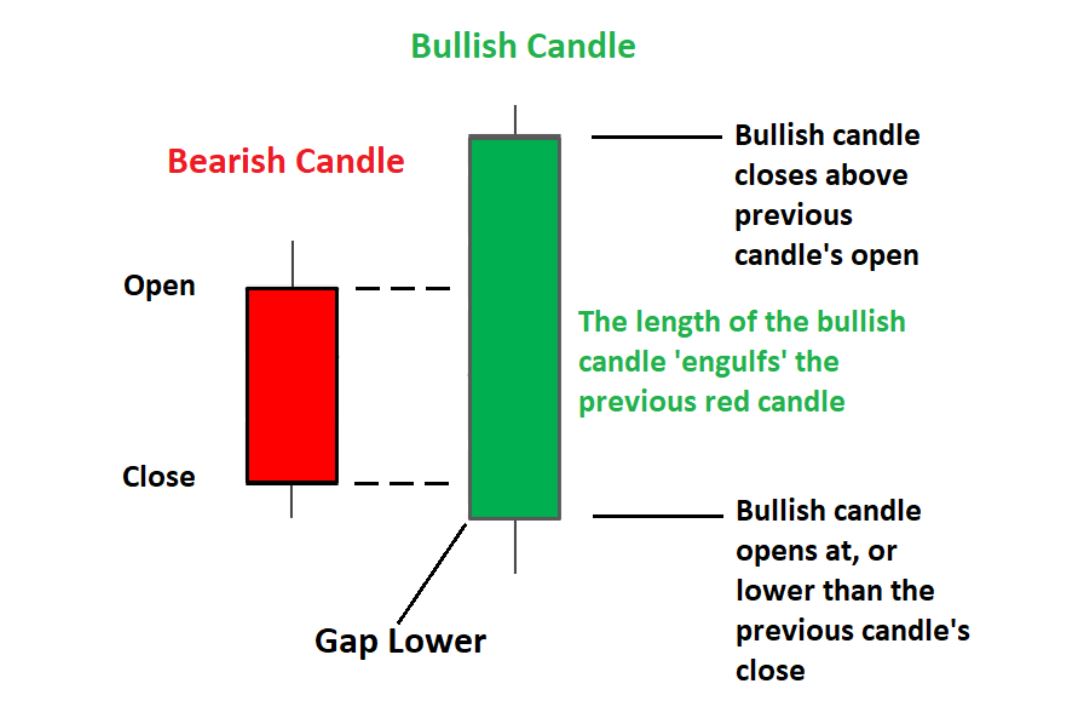
Now that the base is clear, let’s understand the implications this pattern has on investors and their decisions.
As the image shows, a bullish engulfing pattern comes after a downward trend when the selling pressure is already high. When a giant green candle overshadows the red bearish candle, it is the start of a bullish trend. This is day one for investors.
On the second day, bears again try to take the market down, and that reflects in the red candle as shown in the picture. However, the closing is still higher than the previous day’s candle as the bulls try to take charge. That is day two. We can also call this candle a gap up after a gap down in the morning session.
A risk-taking investor may enter the trade on the first or second day, while a risk-averse investor would wait for two to three days for the reversal trend to confirm and continue.
The reversal of the trend occurs as the investor sentiments change from bearish to bullish, and that reflects in the candles. Eventually, it is a win for bulls over bears.
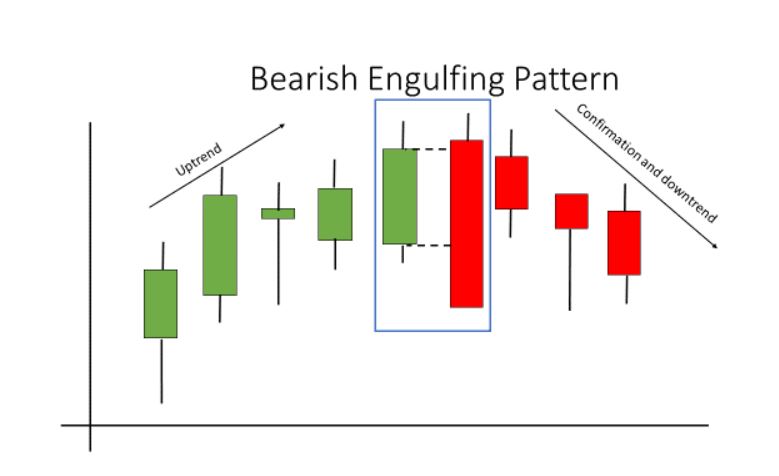
A bearish engulfing pattern is the counterpart of a bullish engulfing pattern. It appears when the market is in an upward trend. Opposite of the bullish engulfing, a big red candle covers a bullish candle and engulfs it completely in the bearish engulfing pattern.
It sets a new course of trend as the market sentiments change to bearish, and investors put pressure on selling. You can see how the candlestick pattern looks in the image below.
Bullish and bearish, both the engulfing patterns work similarly for different market scenarios. The only difference is that the first one leads to an upward market trend, while the latter is a reversal pattern that invites a market downturn.
No candlestick pattern ensures a sure shot result, and a bullish engulfing pattern is no different. If the candles following the bullish candle are Doji, or let’s say the market is going sideways, then even if the market is rising eventually, it doesn’t confirm a trend reversal. This can reduce the effect of the bullish engulfing pattern.
While a bullish engulfing pattern confirms a trend reversal, it does not necessarily help investors determine the range for the coming trend with a price target. Thus, the pattern alone is not enough for investors. They need to combine it with other candlestick patterns or other technical analysis techniques to secure a profitable trade.
Bullish engulfing patterns help investors find a reversal in trend and take advantage of the upcoming market bullishness. It appears when the market is already in the downward trend and covers the bearish candle. It is suggested for investors to wait for two to three days to make sure that the trend reversal alarm is not false. Investors should also use other candlestick patterns or tools to analyze the perfect price target and know when to exit the market.