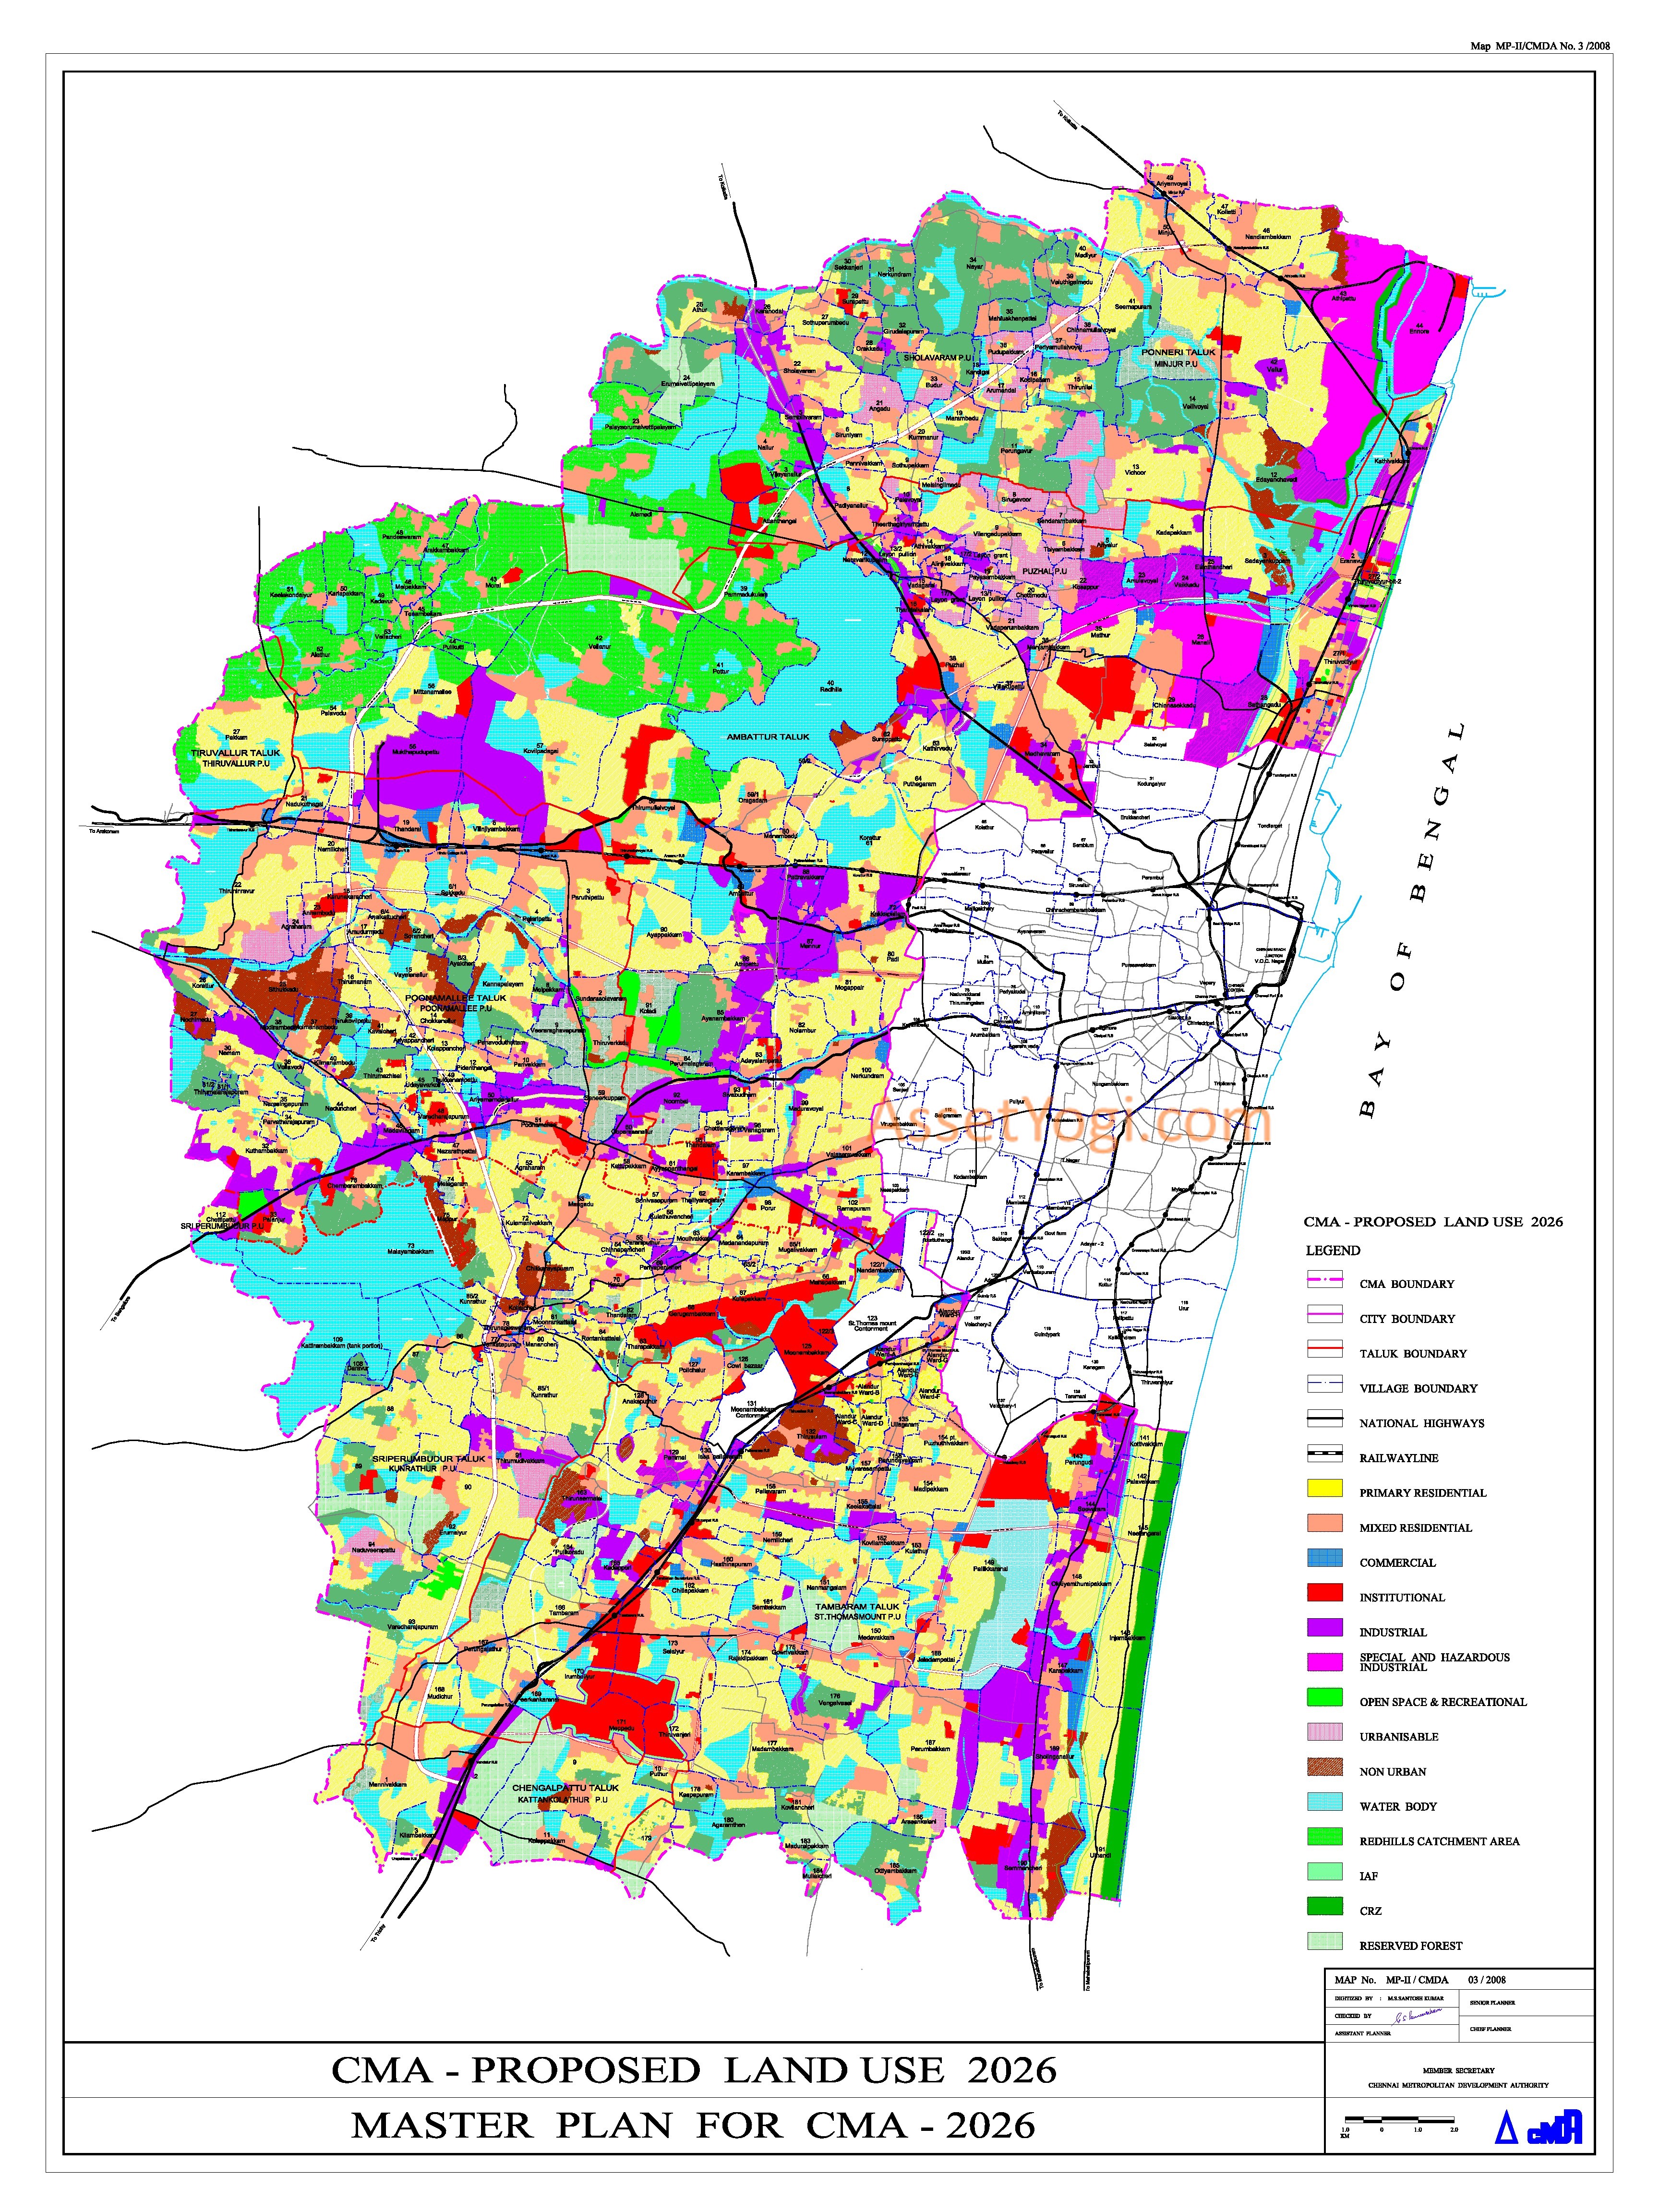
Chennai Master Plan 2026 has been prepared to provide regulations for development and building activity in the city of Chennai in Tamil Nadu. It envisages a population of 58 lakhs for Chennai City and 126 lakhs for Chennai Metropolitan Area (CMA) by 2026. Accordingly, 17,618 hectares for Chennai city and 101298 hectares for CMA are allocated in the proposed land use by 2026 in the master development plan of chennai.
You can download the proposed land use map from below. Check out the Summary of Chennai master plan 2026 below. To share your opinions and suggestions, please use the comments section at the end.
Downloads
PDF Map
Highlights – Chennai Master Plan 2026
Introduction
Chennai, situated on the shores of the Bay of Bengal is the capital of Tamilnadu state. It is the fourth largest metropolis in India. Its older name ‘Madras’ was officially changed to ‘Chennai’ in 1996.
Chennai Metropolitan Area comprises the area covered by Chennai City Corporation (Chennai District), 16 Municipalities, 20 Town Panchayats and 214 villages forming part of 10 Panchayat Unions in Thiruvallur and Kancheepuram Districts. It extends over 1189 Sq.Kms, and has a population of 7.04 million as per 2001 census.
Chennai Master Plan 2001
First Master Plan for Chennai for the year 2001 was approved and notified in 1976. The FMP had estimated that by 2001 the Chennai Metropolitan Area (CMA) would have a total population of 7.1 million including 4 million in Chennai City. Population projected for 2001 for the City and CMA almost tallied with the actual as per Census 2001.
Chennai Master Plan 2011 (Draft)
Draft Second Master Plan 2011 for CMA was prepared and submitted to Government in 1995. The plan approval got delayed due to a writ petition filed in the High Court which was later dismissed in July 2001. In Oct 2001, Government returned the Draft Master Plan 2011 to CMDA directing to modify the Master Plan taking into account the recent urban developments, amendments to the DCR made till then, future needs of CMA etc and resubmit the same.
Chennai Master Plan 2026
Keeping the horizon year for the Master Plan of Chennai as 2026, future demands were worked out and the Second Master Plan was prepared by CMDA. The revised draft Second Master Plan (Chennai Master Plan 2026) was submitted to government by CMDA in December 2005 for approval with a request to give an opportunity to the public and local authorities for giving their suggestions before final approval.
Thereafter, many public objections and suggestions were incorporated in the Master Plan. Chennai Master Plan 2026 (Second Master Plan) was finally approved on 2 Sep 2008 and was notified in the Tamil Nadu Govt. Gazette on the same day.
Economy
Chennai is a major transportation hub for road, rail, air and sea transport connecting major cities inland and abroad.
Chennai is one of the major educational centres in India with a number of colleges and research institutions. Recently it has also been emerging as an important health centre with a large number of super specialty hospitals.
Chennai has become one of the preferred destinations for IT / ITES companies. Tamilnadu is the second largest software exporter in the country, and 90% of the export is from Chennai alone. A large number of IT / ITES developments are located along the Rajiv Gandhi Salai (OMR), the area popularly known as IT Corridor.
Chennai has also emerged as a major export hub in the South East Asia. International car manufacturers such as Ford, Hyundai, and General Motor etc. have established around Chennai their manufacturing bases to cater to domestic and international markets.
Chennai has a diversified economic base anchored by the automobile, software services, hardware manufacturing, health care and financial services industries. According to the Confederation of Indian Industry, Chennai is estimated to grow to a US$100–billion economy, 2.5 times its present size, by the year 2025.
Population
It is estimated that CMA would house a population of 126 lakhs by 2026, of which Chennai City alone would account for 58 lakhs. The population projection of CMA is presented in Table below.
Projected Population for CMA and Chennai City (In Lakhs):
| S.No. | Description | Actual | Projection | Gross Density (Persons/ Hectare) | ||||
| 2001 | 2006 | 2011 | 2016 | 2021 | 2026 | 2026 | ||
| 1 | Chennai City | 43.44 | 46.28 | 49.5 | 52.39 | 55.4 | 58.56 | 333 |
| 2 | Municipalities | 15.81 | 18.52 | 21.75 | 25.6 | 30.2 | 35.69 | 149 |
| 3 | Town Panchayats | 3.86 | 4.73 | 5.89 | 7.41 | 9.45 | 12.22 | 78 |
| 4 | Village Panchayats | 7.31 | 8.7 | 10.59 | 12.96 | 15.99 | 19.88 | 32 |
| CMA [Total] | 70.41 | 78.96 | 88.71 | 99.66 | 111.97 | 125.82 | 105 | |
Strategy – Chennai Master Plan 2026
In order to realize the vision of Chennai Master Plan 2026 in making Chennai more livable and economically vibrant the following strategies are proposed in respect of this sector:
Population Density
Increase overall density of the Chennai Metropolitan Area from the present 59 persons per hectare to 105 persons per hect.; while doing so the density of Chennai will increase from 247 persons per hect. in 2001 to 333 persons per hect. in 2026, while in the rest of CMA the average density will go up from the present 27 persons per hect. to 67 persons per hectare.
High Rise Development
encourage high rise development along wider roads and larger plots; to allow multi-storeyed buildings in the rest of CMA also in order to have planned development with large open spaces on ground.
FSI
allow higher FSI along the MRTS influence areas for residential developments with smaller dwelling sizes.
TDR
consider extension of the Transfer of Development Rights concept for lands taken over for development to solve problems of land acquisition for housing and infrastructure.
Employment
earmark adequate areas in the plan for employment generating activities.
Infrastructure
provide better infrastructure facilities like roads, water supply, sewerage, etc. and provide better connectivity through rail and road transport network to the areas identified for development.
Satellite Towns
encourage development of Thiruvallur and Gummidipoondi as satellite towns as envisaged in the FMP by provision of adequate infrastructure like housing and other developments and providing better housing facilities at affordable cost; to develop new towns/ neighbourhoods near Tiruporur in the southern corridor along Rajiv Gandhi Salai and near Sriperumbudur, in the western corridor along GWT Road.
Other Development Initiatives
- take up housing development near Mahindra Park SEZ either by provision of plots or by regulating layout development by private entrepreneurs.
- encourage green building concept
- provide special facilities to take care of the needs of the elderly persons whose population is likely to go up, e.g. more old age homes, low-floor buses, special seats in buses, special seats in toilets and ramps in public buildings.
- provide for preservation and conservation of ecologically sensitive areas in CMA and to create more parks and playgrounds for recreation purposes.
- encourage social housing provision by private developers of large group developments / multi-storeyed developments through Development Regulations.
- encourage LIG housing by allowing additional FSI of 0.25 to private developers for such developments.
Land Use
Density & FSI
- Chennai is one of the high-density cities in India. Its density varies from 180 persons per hec. in Saidapet and Mylapore Corporation zones and 368 persons per hec. in Kodambakkam zone within the Corporation limits and the gross density for Chennai City is 247 persons per hec. FSI is the main tool used in urban planning to regulate the densities of population with reference to infrastructure provision. Density of population needs to be regulated for various reasons including carrying capacity of infrastructure (existing as well as proposed), sociological reasons such as crime rate etc and other physical factors.
- The existing developments in Chennai can be categorized as high dense medium raised developments mostly of buildings up to 15 m. heights. FSI allowed for such development up to 15 m. height presently is maximum 1.5. Multi stroeyed developments (high rise development) within CMA are very few; in order to encourage amalgamation of smaller plots into larger size and construction of buildings with large open space around, a higher FSI of 2.5/2.75 is allowed in multistoreyed developments.
- The practice of increasing FSI under the disguise of high land cost needs to be discouraged. At the same time allowing higher FSI in the suburbs and lower FSI in central areas of the City also needs very careful consideration considering the carrying capacity of infrastructure, impact on environment including ground water and traffic volumes.
After examing the issue in detail, it is proposed to retain FSI almost as existing and follow it.
Proposed Land Use Plan – 2026
| Proposed Land use 2026 | ||||
| Chennai City | Rest of CMA | |||
| Extent in Hectares | % | Extent in Hectares | % | |
| Primary Residential use zone | 5916.35 | 33.58% | 32090.68 | 31.68% |
| Mixed Residential use zone | 2426.9 | 13.78% | 13503.1 | 13.34% |
| Commercial use zone | 714.24 | 4.05% | 880.35 | 0.86% |
| Institutional use zone | 2868.97 | 16.28% | 3888.85 | 3.83% |
| Industrial use zone | 691.83 | 3.93% | 7274.33 | 7.18% |
| Special and Hazardous Industrial use zone |
130.67 | 0.74% | 3416.08 | 3.38% |
| Open Space & Recreational use zone |
1000.65 | 5.68% | 392.86 | 0.38% |
| Agriculture use zone | —— | ——- | 7295.81 | 7.20% |
| Non Urban | 113.31 | 0.64% | 2332.92 | 2.30% |
| Urbanisable hills | 2075.89 | 2.05% | ||
| Others (Roads, water bodies, hills, Redhills catchments area, forests etc.,) |
3754.79 | 21.31% | 28147.55 | 27.79% |
| Total | 17617.7 | 100.00% | 101298 | 100.00% |
Transportation
Projected Travel Demand
The travel demands have been projected on the basis of increase in per capita trips. The per capita trip that was 1.44 in 2005 (HHI Survey carried out as part of the DPR for the Chennai Metro Rail Project, DMRC, 2005) has been projected to 1.6 by 2016 and 1.65 by 2026.
| (in lakhs) | ||
| Growth of Travel Demand | ||
| Mass Transport Trips (in lakhs) | 2004 | 2026 |
| Total Mass Transport Trips | 35.36 | 145.09 |
| Increase in 22 years | – | 109.73 |
| Total road (bus trips) | 30.22 | 87.05 |
| Increase in 22 years | – | 56.83 |
| Total rail trips | 5.14 | 58.04 |
| Increase in 22 years | – | 52.9 |
Source: Short term study to update CTTS (1992-95)(CMDA, RITES & PTCS, 2004)
It can be seen from the Table above that the number of trips carried by bus transport in 2004 would become nearly 2.8 times in the year 2026. Similarly the volume of passengers to be carried by rail transport will be nearly 11 times the present volume.
Strategies – Traffic & Transportation
- The shelf of urban transport infrastructure projects, based on various studies, incorporated in the draft Master Plan II, has been publicly disclosed.
- A quick review of the shelf of projects, indicate that the targeted modal share of 70% by public transport is fairly realizable provided the metro rail network is implemented in full and the road network expanded by development of elevated highways.
- The total person trips by motorised vehicles constituted 54.5% of all person trips made in the CMA in 2005. The target of 70% of these trips by the public transport (i.e 38.15% of all person trips by motorised vehicles) by 2026 works out to 7.9m trips / day.
- With the implementation of 46km of Metro rail which would carry not less than 0.4m trips / day, the MRTS together with the sub-urban network 0.8m trips / day and the MTC with the expanded fleet size of not less than 6000 and a network of BRT carrying about 7.0m trips / day, the target is fairly achievable (even though the rail transit is expected to carry as much as 6 m trips / day).
- As for the remaining person trips by motorised vehicles (i.e 30% of all person trips by motorised vehicles) works out to 3.4m trips per day by 2026. Implementation of the network of elevated highways, the network of BRT and the series of debottlenecking measures viz. underpasses / overpasses, flyovers, etc proposed in the shelf would assist in coping with these many trips by private vehicles.